
Shining Brighter and Binding Tighter: Fluorometric Analysis of Modified Pepper Aptamer Binding to Fluorinated HBC Ligand
Affiliation: Capilano University, 2055 Purcell Way, North Vancouver, BC V7J 3H5
Abstract
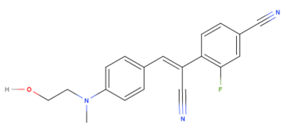
Aptamers and their complementary fluorescent ligands allow for the visualization and observation of many intracellular processes. A fluorinated analogue of HBC (F-HBC) was synthesized, through a Knoevenagel condensation reaction with 4-[(2-hydroxyethyl)(methyl)amino]benzaldehyde and 2-fluoro, 4-cyanophenylacetonitrile. This led to further characterisation of this novel ligand using thin layer chromatography, melting point analysis, 1H NMR, and 19F NMR. The binding affinity of the wild-type Pepper and a mutant Pepper with F-HBC was assessed via fluorescence, in which the fluorescence was indicative of effective binding of F-HBC to the aptamers. This affinity was analysed in varying concentrations of F-HBC, as well as in varying concentrations of MgCl2 to determine the role which Mg2+ plays on the correct and optimal folding of the Pepper aptamer. The differences in the binding affinities for the typical HBC ligand and its fluorinated counterpart on wild-type Pepper were also investigated. The alteration of G41 to A41 and G44 to U44 in the Pepper aptamer resulted in a decrease of F-HBC binding, which adds credibility to the conclusion that Pepper is likely in its most effective conformation. F-HBC had markedly higher binding affinities than that of normal HBC with wild-type Pepper. With most results leading to inconclusive data, there are more questions generated than answers. Thus, with further analysis and more directed research, results may be more fruitful.
Introduction
Cellular biology is the study of the intricate pathways, structures, and functions in what many deem to be the most basic unit of life, the cell (Dupraw, 1968). The identification and characterisation of cellular mechanisms have aided in the development of numerous treatments for a wide variety of ailments that affect not only humans, but other animals as well (Dupraw, 1968). These treatments may be designed to directly combat pathogens such as bacteria by targeting specific signalling pathways, interfering with vital metabolic processes, and more (Werth, 2024). Some malaises have been treated since well before the study of cellular biology. The analysis of inter- and intracellular processes has allowed for the refinement and replacement of many antiquated remedies to yield the most effective treatments with the least amount of harmful side effects (Alberts et al., 2002; Cao et al., 2025).
One key method to visualise intracellular processes in the field of cellular biology is executed with the use of fluorescent proteins (FP). These proteins enable the observation of numerous intracellular processes, including protein synthesis, promoter activity, and more (Snapp, 2009, p. 649). Proteins are not the only biomolecules that are essential to the life of a cell. Of all the DNA in cells, only around 1.1-1.4% is transcribed and then translated into a protein product; whereas roughly 25% of transcribed DNA results in a final product composed of RNA (Chu, 2025a; Pierce, 2019). These RNA products have numerous diverse and vital functions in a cell, including the regulation of gene expression, assisting in protein synthesis, catalysing chemical reactions, and serving a structural role within the cell, among others (Chu, 2025b). As the roles of RNAs are so versatile and important, understanding exactly how and where these biomolecules carry out their function is necessary for the understanding of the internal mechanisms of living cells.
Aptamers are roughly 20-100 long oligonucleotides that can specifically bind to targets and are highly sought-after recognition elements, especially for clinical, biomedical, and pharmaceutical applications (Lee et al., 2023). The first aptamer was formed in 1992 (Lee et al., 2023) and yielded many benefits, including their small size, low manufacturing cost, high thermostability, high physiological stability, and low immunogenicity, along with a wide range of targeting options (Lee et al., 2023). Many of these aptamers utilise green fluorescent proteins (GFPs) to be visualised and require a large ratio of GFP to RNA aptamer for optimal results (Chen et al., 2019). It has yet to be determined if this large ratio of proteins to RNA would impact the function or localisation of biomolecules in vivo (Chen et al., 2019). To limit this possibility, RNA mimics of GFPs (RMFPs) that bind specifically to nonfluorescent analogues of the GFP fluorophore and have a higher signal-to-noise ratio have been investigated (Chen et al., 2019). Upon binding to the RMFP, the fluorophore is able to fluoresce (Chen et al., 2019; Filonov et al., 2014); though, when compared to the fluorescence exhibited by traditional GFPs, RMFPs appear quite dim with a very limited range of colours and are less thermodynamically stable, reducing their versatility in live cell imaging (Chen et al., 2019). Chen et al. (2019) managed to develop a GFP fluorophore-like dye that was able to fluoresce brightly upon its intramolecular motion being constrained. An aptamer that was termed “Pepper” was also synthesised, which was able to bind to, and significantly enhance the fluorescence of this dye in vitro and was able to be successfully expressed in vivo (Chen et al., 2019).
[4-((2-hydroxyethyl)(methyl) amino)-benzylidene]-cyanophenyl-acetonitrile, more commonly known as HBC, is the ligand that selectively binds to the Pepper aptamer allowing for its signature green fluorescence (Song et al., 2024). Interestingly, the dialkylamino group plays the role of the electron donor while the cyano group is the structurally rigid electron acceptor in this molecule (Bereiter & Micura, 2025; Chen et al., 2019). HBC also has a low molecular weight and cytotoxicity and can effectively pass through membranes, making it an efficient biological marker (Chen et al., 2019) and allowing it to be useful in vitro and in vivo studies. HBC specifically fluoresces under the condition that the molecule itself is restricted from its usual rotations or vibrations (Chen et al., 2019).
The structure of the Pepper aptamer allows for the binding of HBC. This RNA sequence provides a binding pocket in the middle of its structure (Figure 1) (Song et al., 2024). This is formed by a wobble-base pair at the top, consisting of G10 and G40 (Song et al., 2024). The bottom is made up of a non-G-quadruplex, including G41, U42, C43, and U8, forming a platform on which the HBC may rest (Song et al., 2024). A terminal hydroxyl group in the HBC allows for hydrogen bonding to G41, strengthening the binding to Pepper (Song et al., 2024). Additionally, an Mg2+ ion interacts with G9, A6, C7, and U8 of the RNA, facilitating the correct folding of the structure, which allows HBC to interact with the aptamer (Song et al., 2024). HBC and Pepper create one order of magnitude more cellular brightness (Song et al., 2024), which makes this pair highly sought after.
This study aims to research the relationship between the wild-type Pepper aptamer and a modified Pepper, and how this will change the ligand-aptamer binding, subsequently impacting the fluorescence of the sample. Included in this aim is another factor, the addition of a fluorine atom onto the HBC (F-HBC; Figure 1) molecule to determine whether the fluorine could influence the binding of the fluorophore to the wild-type and the modified Pepper. The fluorine addition would increase the lipophilicity and the overall basicity of HBC, which could result in greater uptake of the molecule through the cell membrane (Shah & Westwell, 2007), potentially allowing for better results in vivo. Fluorine is also commonly added to medicinal compounds as it can decrease metabolism of molecules when in certain positions, especially when near the site of metabolic attack (Shah & Westwell, 2007), and its addition to the HBC molecule may allow for a greater bioavailability and thus a more thorough understanding of cellular processes. With fluorine’s strong electronegativity, it is often used to increase a molecule's binding affinity to its target by acting as a hydrogen substitute (Shah & Westwell, 2007). Fluorine’s addition allows for stronger hydrophobic interactions in the hydrophobic region of the aptamer’s binding pocket (Pietruś et al., 2022) and thus hypothetically strengthening the binding between F-HBC and Pepper. A fluorinated HBC would also allow for other types of testing, either on the molecule itself, such as F-NMR, or in vivo as a radiolabel using 18F. Using radioactive fluorine as a radiolabel in vivo would enable the visualisation of the molecule to see if it is sequestered in a specific region in the cell (Costa et al., 1978). No studies yet have analysed the impact of fluorinated HBC binding affinity or fluorescence intensity; therefore, analysis of this is an essential part of further research (Vaughan, 2025a). Huang et al. (2021) discovered that the tertiary structure of Pepper, and in conjunction, the stability of its HBC binding pocket, were reliant on the presence of Mg2+. An additional variable that is essential to proper folding of the Pepper aptamer is whether the inclusion of Magnesium at differing doses would alter the affinity of the RNA and the fluorinated ligand.
As of yet, no further optimisation of the Pepper aptamer has been successful (Huang et al., 2021; Vaughan, 2025a). In this study, the effects of alterations to the Pepper sequence as well as a modification of the structure of HBC are examined with regards to binding affinity and the effects they have on fluorescence in normal and varying levels of M g2+. The proposed modifications to the Pepper aptamer will likely result in a significant decrease in the affinity between the RNA structure and F-HBC when compared to the wild-type aptamer. In contrast, the fluorination of HBC is suspected to increase the affinity of the fluorophore and the wild-type and mutant aptamers.
Results and Discussion
Design of mutant Pepper. When originally examining the structure of the Pepper aptamer via UCSF Chimera, the importance of the nucleotide bases surrounding the HBC-binding pocket became evident. When HBC is bound to Pepper, G41 of the aptamer forms a hydrogen bond with the hydroxyl of the ligand. Not only that, but as stated in Song et al. (2024), the non-G-quadruplex base containing G41 provides a platform for HBC when bound within the pocket. This allows for stronger binding of HBC to the aptamer, and the tighter restriction of the fluorophore’s intramolecular motion results in greater brightness (Chen et al., 2019). With the objective of altering the binding affinity between Pepper and its fluorophore, G41 was chosen to be mutated to an A41, with the thought that A41 would not have as many interactions with the surrounding aptamer bases, which could impact the positioning of the purine, thus hindering π-stacking between the nucleotide and HBC.
A second mutation was made to the wild-type Pepper sequence, alongside the alteration of G41 to A41. G44 was chosen to be mutated to C44 as it appeared to be indirectly involved in ligand binding. G44 binds directly to the hydroxyl group of U42 which is also a part of the non-G-quadruplex that makes up the platform HBC rests on (Song et al., 2024). Due to its position in relation to the ligand, it was hypothesised that U42 interacted directly with HBC via π-stacking, as well as hydrogen-bonding with G10 which itself likely interacts with the ligand via π-stacking. Changing G44 to a C44 was expected to have an impact on the binding affinity of Pepper to HBC, as C44 would not interact with U42 as strongly, which could have shifted U42 out of position, hindering π-stacking with the ligand and U42’s base, as well as U42’s hydrogen bonding with G10 which could have resulted in the added effect of shifting G10 into a less favourable position for π-stacking, further decreasing binding affinity.
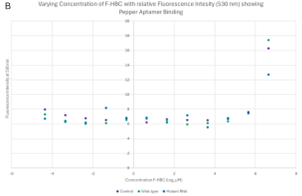
The results of these two modifications to the Pepper aptamer were observed in the first of the fluorescent activation assays with varied F-HBC concentrations (Figure 2). The mutant aptamer showed a significant decrease in fluorescence compared to the wild-type aptamer. This aids in affirming that the changes that were made to the RNA sequence did result in a decrease in the binding affinity between Pepper and F-HBC, as was hypothesised.
In hindsight, if the fluorination of HBC was known about before submitting the primers for synthesis, further investigation into attempting to increase Pepper’s binding affinity to the ligand could have been done. Increasing the lipophilicity of the binding pocket in the region that could interact with the fluorine, may have increased binding the affinity of F-HBC and the mutant Pepper.
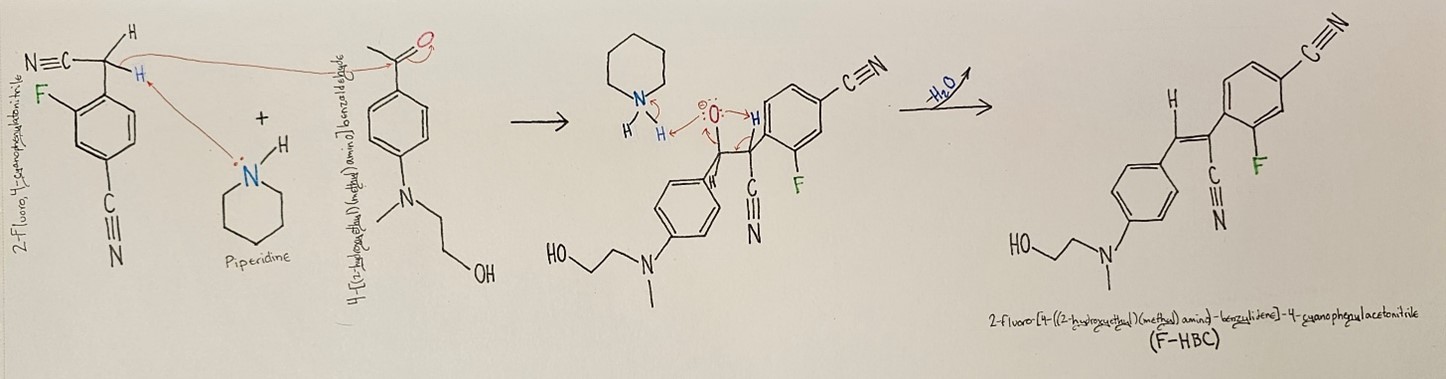
Synthesis of F-HBC. A fluorinated analogue of the HBC fluorophore (F-HBC) (Fig. 1) was synthesised via a Knoevenagel condensation reaction between 4-[(2-hydroxyethyl)(methyl)amino]benzaldehyde (further designated as the “aldehyde”) and 2-fluoro, 4-cyanophenylacetonitrile (further designated as the “nitrile”) with piperidine acting as the catalyst (Figure 2). The addition of 0.0900 g of the aldehyde reactant into 10 mL of pre-dried methanol resulted in the aldehyde quickly dissolving and the solution turning a clear yellow. After the addition of 0.1549 g of the nitrile and one drop of piperidine, the reaction mixture became an increasingly bright yellow over the course of an hour. After one hour, the reaction mixture’s contents were evaluated via TLC, and the reaction was continued. After 13 days, the F-HBC reaction mixture contained a dark yellow, almost orange colour product, and a dark brown band was present at the top of the reaction flask. The solid contents of the flask were filtered via vacuum filtration, resulting in 0.0672 g of a vibrant orange product once dried.
Initial Thin Layer Chromatography (TLC). Two TLC tests were initially performed on the reaction mixture after one hour of reaction, utilising different solvents, 1% ethyl acetate in dichloromethane and 3% methanol in chloroform. This was to confirm the reaction was progressing and identify which solvent would result in better separation of the reactants and product for future purification analysis of F-HBC. Elution in 3% methanol in chloroform performed markedly better than the elution in 1% ethyl acetate in dichloromethane. It showed a clear separation of compounds, as indicated by the greater difference in Rf value of the reaction product to the Rf value of the aldehyde reactant (Rfproduct=0.13; Rfaldehyde=0.06; difference in Rf=0.07) in the lane containing the reaction mixture than in the plate run in 1% ethyl acetate in dichloromethane (Rfproduct=0.03; Rfaldehyde=0.01; difference in Rf=0.02). The difference in the separation of the nitrile and the product on both TLC plates was not a cause for concern, as its separation was very visually evident when compared to that of the aldehyde and product. The separation of different compounds in TLC is dictated by the polarity of both the compound and the eluent. More polar compounds travel further on TLC plates that are run in more polar solvents (Thin Layer Chromatography, 2013). As methanol is more polar than ethyl acetate (Nti-Gyabaah et al., 2010), it causes the less polar nitrile to move further than the more polar compounds. As the aldehyde is more polar than F-HBC, the polar solvent would cause F-HBC to travel further, which aligned with the acquired TLC results of the reaction mixture and aided in the verification of the synthesis of F-HBC.
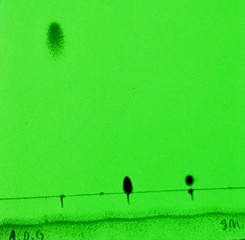
Characterisation of F-HBC. Melting point analysis on the F-HBC product was performed after initial purification and drying, producing a wide melting range of 129℃-134℃, indicating impurity (Dent, 2006). The purity of the product was analysed via TLC using 1% ethyl acetate in dichloromethane as the solvent. No nitrile impurity was identified in the product, although there was evidence of residual aldehyde (Figure 3). The use of 3% methanol in chloroform as the TLC solvent may have allowed for greater separation between F-HBC and the aldehyde, though, as both compounds were quite distinct from one another, it is not likely that there would have been other useful information to glean from another TLC run.
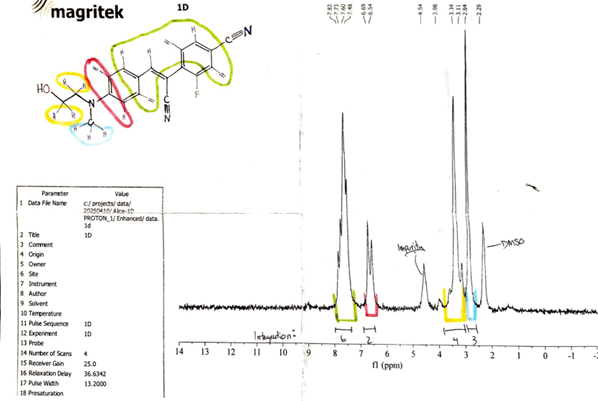
A 19fluorine NMR (19F NMR) was run with DMSO as the solvent, on the product which, confirmed that a fluorinated product had been produced. A proton nuclear magnetic resonance (1H NMR) was run in DMSO to analyse the product’s structure and confirm it was F-HBC (Figure 4). Signature peaks were observed at values that had matching peaks in the predicted F-HBC 1H NMR spectrum (Castillo et al., 2011). A strong peak was seen at 3.34 ppm, overlapping the expected peaks of the hydroxyethyl hydrogens of HBC. This peak matched the expected ppm for H2O contamination in DMSO (Fulmer et al., 2010), suggesting that the product had residual water. A peak was also seen at 4.54 ppm, which alluded to the presence of other impurity in the sample when compared to the predicted results (Fulmer et al., 2010). The results for each form of analysis suggest that the synthesis of F-HBC via Knoevenagel condensation was successful; however, they also indicate the presence of impurities in the final product.
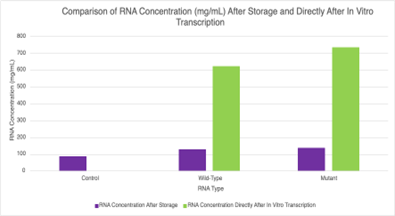
RNA concentration. Determination of RNA concentration was a crucial step in this study, as fluorescence between F-HBC and Pepper depended on the binding between the two. More RNA available for binding allowed for F-HBC to be the limiting factor in how much fluorescence will occur. This is why an investigation was conducted later in the study on the RNA concentration after 3 weeks of storage and the concentration directly after in vitro transcription, without purification. The RNA used at the beginning of the study was stored for three weeks before any testing occurred, in vitro transcription was undertaken on the 13th of March 2025, where it was then purified on the 20th of March 2025 and the first set of 96-well plates were analysed on the 4th of April 2025. Over time, storage may have led to a large amount of degradation of RNA, it is also possible that the purification of the RNA may have resulted in significant loss, all of which would have led to potential problems in the analysis of the results. RNA concentration after 3 weeks of storage was analysed, along with RNA concentration directly after in vitro transcription on the 17th of April 2025. RNA concentration was calculated using the Beer-Lambert equation, with an extinction coefficient of 0.025 mg/mL cm-1 (“Quantitating RNA…”) and a path length of 0.1 cm3 (Vaughan 2025j) along with the absorbance collected at 260 nm. A result in the control section may signify a potential contaminant in the well of the 96-well plate that absorbed wavelengths at 260 nm and was not RNA. If this contaminant was present in one of the various solutions that was used, it may have affected the results of the RNA concentration, making them appear higher than they were. This could have had significant ramifications on subsequent analysis, as it may have caused a low concentration of RNA in the solution of the wells to be evaluated as having a higher concentration. This could have led to the assumption that the aptamer is not as proficient at binding to the F-HBC as it was. Significant differences were observed where the stored RNA had dramatically lower RNA concentrations compared to the RNA measured immediately after transcription (Figure 5). This is astounding as transcription was not completed for the recommended 3 hours, and it indicated that storage and cleaning may have resulted in a significant decrease in RNA concentration.
The first conclusion is that fluctuations in temperature may cause RNA molecular energy to alternate, creating the environment for weaker bonds to bind more tightly and then less so when the temperature increases (Igor et al., 2024). The optimal temperature range for RNA storage would be -20℃ to -80℃ (Igor et al., 2024). Not only that, but reactive oxygen species that are in the atmosphere may have also played a role in the RNA’s degradation over time, along with humidity levels allowing for RNA to undergo hydrolysis (Igor et al., 2024). It would be beneficial to store the RNA in a desiccant and in air-tight containers (Igor et al., 2024). Chemical reagents play a large role in the stability of the RNA, and in which RNA could be stabilized. An example of this and a potential improvement to maintain RNA concentration over time is the use of DMSO to protect the RNA from freezing and thawing (Igor et al., 2024).
Another critical way in which the RNA could have been degraded is through mechanical stress, which is mainly caused by shaking, flicking, or even through the use of a centrifuge (Igor et al., 2024). In the stored RNA sample, purification was also conducted with multiple rounds of centrifuging the RNA, which could have caused extensive fragmentation in the RNA (Igor et al., 2024). A potential way to improve this would be to conduct cleaning through column chromatography, where there is no mechanical stress being placed on the RNA sequence.
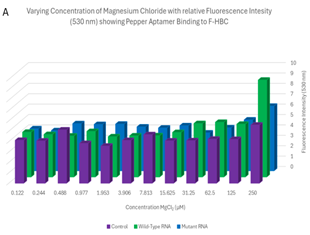
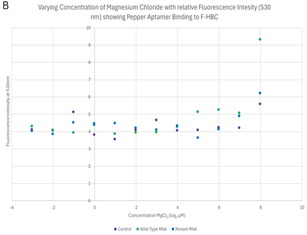
Varied MgCl2 plate readings. In order to evaluate the importance of Mg2+ in the binding of F-HBC, the fluorescence of 100 μL mixtures containing 1 μM F-HBC, either 25.3 μg of wild-type Pepper RNA or 26.8 μg mutant Pepper RNA, and varying concentrations of Mg2+, all in HEPES, pH 7.4, containing 100 mM KCl buffer were observed in a 96-well plate and compared to controls not containing any RNA. The tertiary conformation of the wild-type Pepper aptamer is dependent on Mg2+, and the nucleotides in the HBC-binding pocket have direct interactions with Mg2+ ions (Huang et al., 2021). The results of the fluorescence activation assay of the wild-type and mutant Pepper aptamer indicated that the mutations that were made to Pepper did not have any significant impact on the aptamer’s reliance on Mg2+, as there was no significant difference in fluorescence at 530 nm between the wild-type and mutant aptamer (Figure 6). There was, however, a significance when examining the effect that varying concentrations of Mg2+ had on fluorescence at 530 nm. Wells with higher concentrations of Mg2+ seemed to have had increased fluorescence when compared with wells containing less Mg2+. From these results, it cannot be surmised that the mutations made to the aptamer did not increase nor decrease Pepper’s dependency on Mg2+, as the results were statistically insignificant.
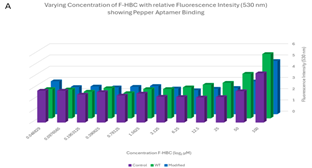
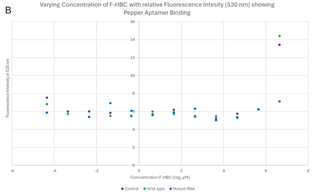
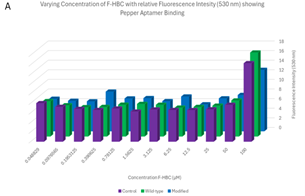
Varied F-HBC readings, part one. One of the first plates analysed showed some of the most promising results, where an exponential trend can be seen in both the 3D column graph and the scatter plot of Figure 7. These results showed higher levels of fluorescence for 6 of the first concentrations of wild-type Pepper aptamer, indicating effective binding of F-HBC. The mutant did have higher fluorescence than the control in the highest concentration condition, showing binding with F-HBC, but after that, the fluorescence values matched the control values. This was unexpected as with mutant Pepper present there is still an aptamer the F-HBC could bind to which should allow for higher fluorescence than in the control with no substrate for the F-HBC to bind to. The ANOVA conducted on these results showed a statistically significant difference between the different RNA conditions, as the p-value obtained for Figure 7 was 0.01143, which is significantly lower than the set α value. This shows a statistically significant difference between the binding of F-HBC to the different RNA conditions. The wild-type is most likely the cause of the difference; however, post-hoc tests would need to be conducted to verify this. With the assumption that the wild-type aptamer is causing the significant difference, it can be inferred that F-HBC binds more readily to the wild-type Pepper than to the mutant aptamer. For the conditions depending on the concentration of F-HBC, the ANOVA showed high statistical significance, the p-value was approximately zero, indicating that as concentration changes so does the fluorescence values and therefore so does the potential amount of binding occurring.
Three different excitation wavelengths were analysed for all plate readings and these included those discussed above: 488 nm, 478 nm, and finally 410 nm. The 410 nm was used due to an absorbance run that was done on a sample of the wells and a peak was observed. This excitation wavelength was not used in the end for result analysis because the data obtained seemed to contain irregularities and the validity of this procedure was questioned.
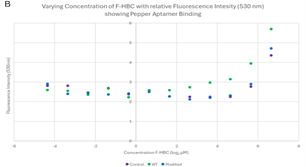
Varied F-HBC readings, part two. The 96-well plates were recreated with an RNA sample that did not undergo purification and had recently been replicated via in vitro transcription and therefore had the highest concentration of RNA (refer to Figure 5). This should have allowed for better visualisation of the effects that varying amounts of F-HBC would have on the fluorescence, thus showing more conclusive data to deduce the binding affinity of both the wild-type and the RNA aptamer. This was analysed three times with different excitation wavelengths of 488 nm, 478 nm, and 410 nm, as stated previously, the 410 nm results were not considered relevant. The overall trend observed in the plate results, read at 485 nm (Figure 8) and 475 nm (Figure 9) excitation, indicated stability in the lower concentrations, where there was an almost straight line, until the highest concentration of F-HBC (4.762 μM or 7.966 log2 μM), which has a high fluorescence intensity. In the case of Figure 8, the wild-type and the control have the highest amount of fluorescence, with the mutant fluorescence levels showing the same amounts as the lower concentrations of F-HBC. Higher fluorescence intensity in this case usually indicated an increased binding affinity; therefore, the difference between the mutant and wild-type aptamers confirmed the hypothesis that it would not be possible to increase the binding affinity with the changes made to the Pepper aptamer (Huang et al., 2021; Vaughan, 2025a).
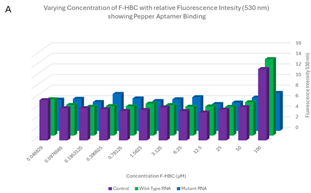
These results are on par with the Two-Factor ANOVA that was conducted for both excitation levels, where no statistical significance was seen between the control, wild-type Pepper, and the mutant aptamer. The p-value comparing the different conditions varied but stayed significant, as for Figure 8 it was 0.459 and for Figure 9 it was 0.529, which was drastically higher than the set α value of 0.05; therefore, between these variables, there is no difference in fluorescent intensity, thus no binding difference between the two RNA samples. The very similar fluorescence values of the lower concentrations for all conditions were also analysed by ANOVA at both excitation wavelengths, and at both, the differences between concentrations were statistically significant, as they were below the α value. Adding to the results that were unexpected was the control, which consisted only of Buffer, DMSO, and F-HBC, which had higher fluorescence values than the mutant aptamer. The fluorescence in the control could be due to something in the buffer that causes fluorescence at these wavelengths. Another potential reason for this high fluorescence could be due to contamination from the 96-well plates being used multiple times and not being properly cleaned; therefore, residues from previous work may have impacted the results.
HBC compared to F-HBC. A critical part of this paper is understanding how HBC differs from F-HBC, and which, if any, has a better ability to bind to the Pepper aptamer. It is important to restate that the ability for HBC and F-HBC to fluoresce occurs once this molecule has been bound to the aptamer which constrains its intramolecular motion, resulting in the release of light. Therefore, based on the results shown in Figure 10, it is expected that the overall fluorescence will increase when the Pepper aptamer is present. It is important to note that the data for the normal HBC was obtained from Derrick and Duncan (2025), with permission.
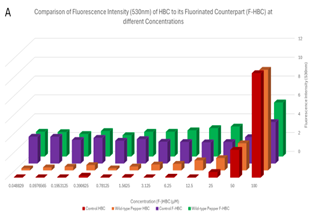
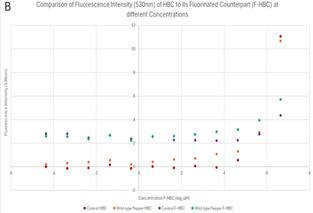
The normal HBC control condition had the lowest amount of fluorescence, with some values going into the negatives, as seen in Figure 10B, which were then interpreted as 0 for Figure 10A. This would indicate a data set with no contamination, as the control should have no fluorescence; on the other hand, the normal HBC and wild-type Pepper conditions showed very low fluorescent values and therefore very low binding affinity. This could be due to many factors, but the main issue would be the degradation and therefore low concentration of RNA, which may have impacted different experiments more severely than others. Comparing the normal HBC conditions to the F-HBC conditions, there is a significant increase in fluorescence values for both control and Pepper. The difference between the control HBC and the F-HBC could be due to the addition of the Fluorine or other factors, as logically there should be no binding and therefore no fluorescence. More importantly, an increase in fluorescence is observed for the wild-type Pepper complexed with F-HBC when compared to the fluorescence of the wild-type Pepper complexed with normal HBC. This could be inferred as F-HBC having a stronger binding affinity to wild-type Pepper than HBC does, reinforcing the hypothesis that the fluorination would increase affinity between the ligand and aptamer. This could lead to the hypothesis and further testing of Fluorinated-HBC and its binding properties to the Pepper aptamer, and whether this increase in fluorescence is due to the F-HBC or the contamination from the control that has spilled over. These results are supported by the ANOVA that was run as the p-value for the comparisons between HBC and F-HBC was 0.0088, much lower than the α value of 0.05. This statistical significance indicates the possibility for an increase in effective binding, and therefore fluorescence, that can be further explored in the future, where F-HBC could be used more readily than HBC due to the increased binding affinity.
Conclusion
The ability to identify and understand the intricate processes that occur in cells is important to many fields including in the development of nouveau medicinal compounds. The Pepper aptamer has proven to be an exceptional biomarker in the pursuit of understanding intracellular mechanisms. The highly specific binding-site has yet to be further improved, and it seems that any alteration to it results in structural changes that decreases its binding affinity to the fluorophore. This would imply that the aptamer is in the most stable conformation and the binding pocket has the highest affinity possible.
Another option in attempting to increase the binding affinity between Pepper and HBC is to alter the structure of the fluorophore. Fluorine is often added to ligands to increase the binding affinity to their respective receptor. The addition of a fluorine to HBC was shown to have a significant increase in fluorescence in the wild-type Pepper/F-HBC complexes when compared with wild-type Pepper/HBC complexes. Whether fluorination increased the binding affinity between the mutant Pepper and the fluorophore was unfortunately not determined, and future studies may want to investigate the effects that fluorination has on the binding affinities of ligands and receptors that are not as complementary to one another.